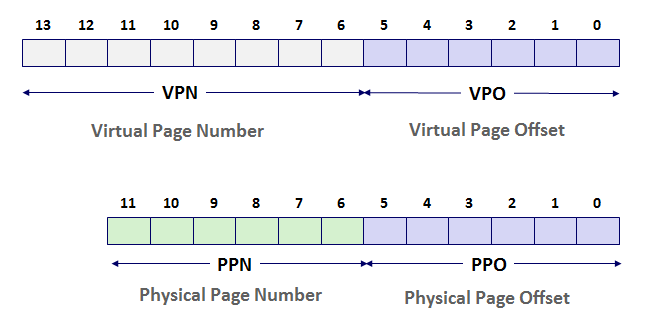
Using the same example from Section 9.6.4 for mapping 64-byte (26) pages from a 14-bit virtual address space to 12-bit physical memory,
The table from Fig. 9.20(b) on p. 796 shows a potential mapping of virtual pages (VPN) to physical pages (PPN).
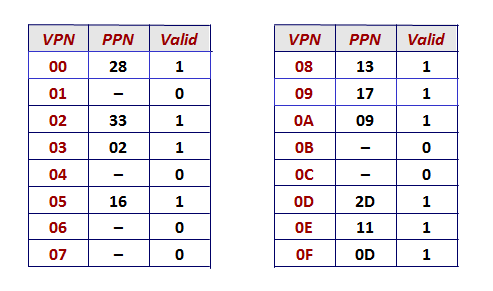
Given this table, for the following virtual addresses, determine their mapping and indicate either the corresponding physical address or page fault (if the page is not in memory):
- 0x02AD
- 0x015A
- 0x011E
Problem #6.26, at the end of Chapter 6 (p. 632).
Answer the following related questions:
- Problem #6.31, at the end of Chapter 6 (pp. 634-635)
- Problem #6.32, at the end of Chapter 6 (p. 635)
- Repeat Problem #6.32 for the address 0x13DE
- Repeat Problem #6.32 for the address 0x16C9
Hint: Be careful of your answer on part b.
A given computer system has the following cache access times:
- L1 cache: 3 processor cycles
- L2 cache: 10 processor cycles
- L3 cache: 30 processor cycles
- Main memory: 120 processor cycles
-
Program A has the following miss rates:
- L1 cache: 4%
- L2 cache: 30%
- L3 cache: 50%
- Main memory: (assume it always hits in main memory; i.e. miss rate is 0%)
-
What are the hit rates for each cache level?
-
What is the average memory access time (AMAT) for Program A?
-
Program B has the following hit rates:
- L1 cache: 93%
- L2 cache: 80%
- L3 cache: 65%
- Main memory: (assume it always hits in main memory; i.e. hit rate is 100%)
-
What are the miss rates for each cache level?
-
What is the average memory access time (AMAT) for Program B?
-
Oftentimes, the program with the lower L1 cache miss rate has the better (lower) average memory access time (AMAT)? Is that true in this case? If not, why?
-
For Program A, what speedup would be achieved if you were able to optimize the program to achieve an 85% hit rate in L2 cache?
Note: "Speedup" refers to the ratio (fraction) of the original AMAT (with 30% miss rate) to the new AMAT (with80%85% hit rate). -
For Program B, if the L1 cycle access time was increased from 3 cycles to 4 cycles (during architecture design), what minimum hit rate would be needed in the L1 cache to achieve the same AMAT?
Using the following assembly code
      some_proc:
           mrmovl   4(%esp), %ecx
           mrmovl   8(%esp), %edx
           mrmovl   12(%esp), %ebx

        LOOP:
           mrmovl   0(%ecx), %edi
           mrmovl   0(%edx), %eax
           addl     %eax, %edi
           rmmovl   %edi, 0(%edx)
           iaddl    $4, %ecx
           iaddl    $4, %edx
           iaddl    $-1, %ebx
           jne      LOOP

           ret
-
Identify all the true (a.k.a. read-after-write) data dependencies. Identify them by drawing circles around the dependent operands and drawing arrows between them (i.e. draw an arrow from each register write to the next read of that register... in a fashion similar to that used in class, and demonstrated on p. 398).
Hint: Be mindful of loop-based dependencies.
-
Using a high-level pipeline diagram (such as used in Figures 4.44 or 4.54), for the sequence of code given above, show the state of the pipeline from cycles t through t + 16 (i.e. until you run out of room on the paper).
Assume the mrmovl 0(%ecx), %edi instruction is in the Fetch stage in cycle t.
Watch out for Load-Use data hazards and Branch Mispredict control hazards.
Note 1: Assume that the conditional branch is predicted as not taken (i.e. condition is False), but upon execution, it resolves as taken (i.e. condition is True).
Note 2: Assume that forwarding/bypassing is being used in the pipeline.
Note 3: This example assumes the existence of an iaddl instruction (which is just like addl, but allows an immediate for first source). -
At the end of the t + 4 cycle of execution, which registers are being read and which are being written?